
I’ve watched hundreds of people present their data.
- Professionals presenting project outcomes
- Scientists sharing research data
- Businesses pitching for funding
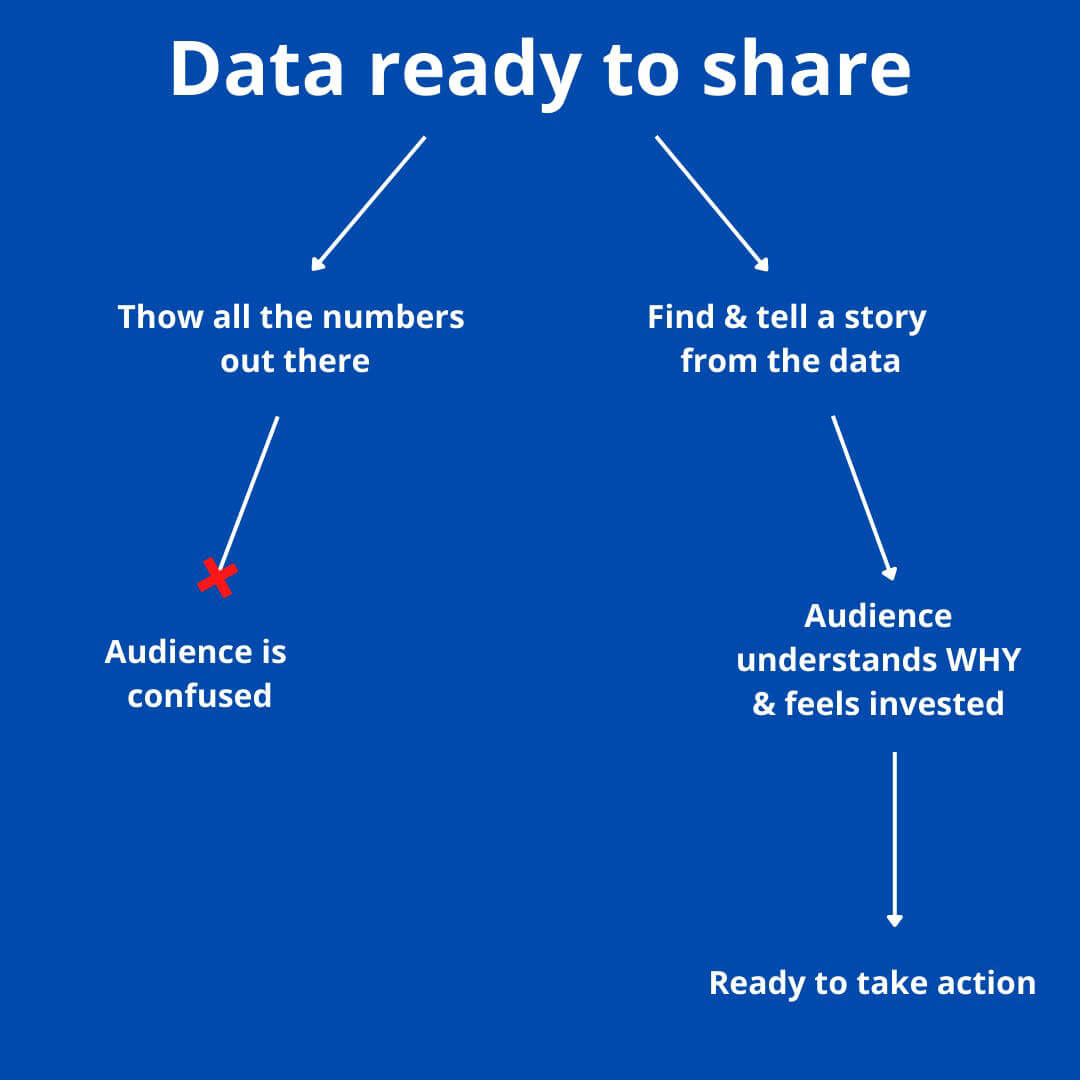
Often I leave feeling confused.
90% of the time, the numbers are simply thrown at me and I struggle to make sense of them.
Each time we present data, we HAVE to be able to do it in a meaningful way.
It doesn’t matter how smart you are, or how great your results are. If you can’t convey that to your audience, the message will be completely lost.
We need to find the story in our data.
If an insight or a finding isn’t understood by the audience, the outcome is simple:
No change will occur.
If the audience can’t make it sense of it, nobody will act on it.
So to be able to get action from your data, you need to be able to communicate it effectively.
This is where storytelling comes in.
“Data are just summaries of thousands of stories — tell a few of those stories to help make the data meaningful.” ~ Dan Heath, bestselling author
Data storytelling involves 3 elements:
- Data – this core information to convey
- Visuals – this enlightens the audience to see things in the data they wouldn’t otherwise see
- Narrative – this engages the audience to feel connected to and inspired by the data
Each of these elements work together to explain, enlighten, and engage the audience. If any one is missing, then you lose the impact of your message.
Do we skew the data by telling a story?
Surely if the number are good, they can stand alone? Why should we ‘dress them up’ with fancy visuals or compelling storytelling?
The answer is simple: great data presenting isn’t about fudging numbers. Instead, it’s about finding and meeting your audience where they are.
This is the same as with any presentation – finding a great narrative is knowing:
- Who is in the audience?
- What do they know already?
- What do they care about?
- What decisions to they need to make?
- What are their goals to get there?
Once you have this understanding, you can pinpoint the data that matters.
Everything in life needs context, and data presentation is no exception.
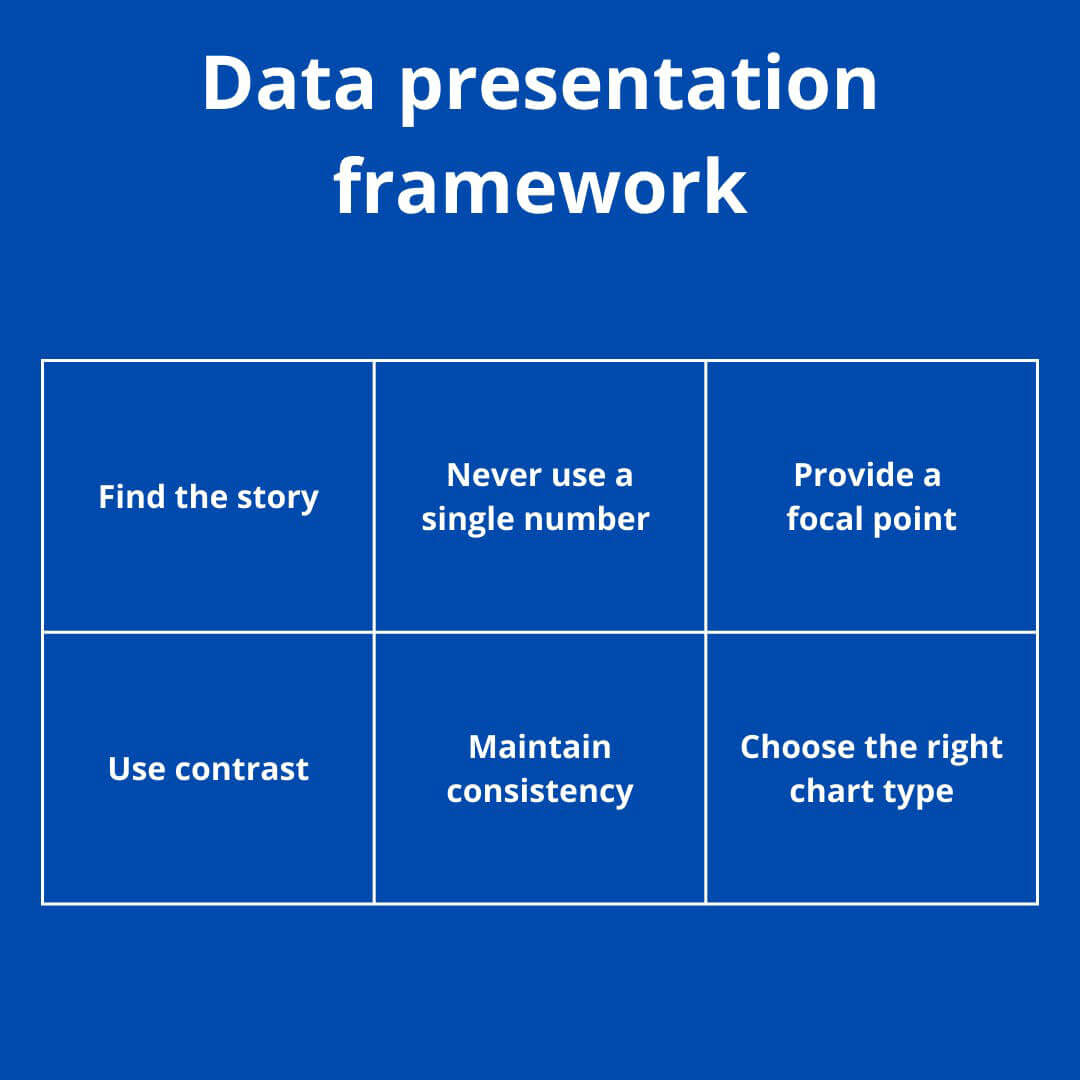
6 steps to present your data in a meaningful way
Every time you present data, your outcome will be greater if you follow these simple steps.
1. Tell a story with your data.
Presenting data is exactly the same as any other type of presentation. You need to draw your audience in with storytelling.
A simple way to find a story is to delve into these 3 things:
- Setup
- Conflict
- Resolution
Take time to find the story in your data before create your graphics.
2. Never use a single number.
The best presenters know that a single number makes no sense.
A study by Professor Chip Heath (Made to Stick author) found that 63% of students could remember stories, but only 5% could remember a single statistic.
Comparing data can provide more meaning than single numbers.
“865 subscribers” is a meaningless number on its own.
But if you saw that for the last 5 years there were only 10 subscribers and this year there was 865, then things change. You start to wonder what the reason is behind the dramatic increase. And the story starts to appear.
Comparison figures give context and help the audience understand.
3. Provide a focal point.
When we look at a complex charts our eyes dart all over the place while we desperately try to make sense of it.
Instead, when we highlight a specific area of a graph we channel the audience’s attention to the story.
Adding arrows or simple annotations is a bulletproof way to do this.
It tells the audience where to look and what’s important.
4. Use contrast.
99% of the time when I look at a data slide, I have no idea what it’s supposed to be telling me.
Contrast helps draw the eye.
You can use contrast in many ways:
- Color – making one item a different color
- Size – making one item larger than the others
- Orientation – rotating one item
The contrast makes it easier for the audience to make sense of data.
5. Maintain consistency.
Too often slides have charts that are completely inconsistent.
Presenters cut and paste from a range of sources, then combine them all into one presentation.
Instead, take time to create charts yourself and maintain consistency with:
- Color
- Font
- Size
This makes it dead-simple for the audience to read and interpret.
You don’t need to be a design expert to do this. I use Canva because it’s a really simple tool to use to do this well (and my Canva course gives a run down of how to get started).
6. Choose the right type chart type.
The choice of chart is critical.
Most people go straight for a pie chart because it’s the simplest.
Don’t do this.
Consider what type of chart best represents the story you’re telling.
Think beyond the tables
Data on its own isn’t going to make change happen.
It’s all about how we share that data in an engaging and meaningful way.
I will end with this: “The goal is to provide inspiring information that moves people to action.” – Guy Kawasaki, author & venture capitalist